

The Gatus it's great for monitoring as code, but it leaves out two things many teams ask for: registering a monitor through the web without editing the YAML, and publishing an open status page while the dashboard stays protected. The Go Uptime was born to fill those gaps. It's a project derived from Gatus, in a single Go binary, that keeps the configuration in YAML and adds web administration, public status pages, push compatible with Uptime Kuma, MySQL/MariaDB, login screen and backup. In this guide, you'll see what changes compared to Gatus, spin up Go Uptime with Docker or systemd, and configure each new feature.
Where Go Uptime comes from
The Go Uptime started in 2026 as a fork of Gatus, by TwiN, from a commit on 8 September 2026. Since then v6.0.0 it has followed its own path: the HTTP server and the command line were rewritten. Until v6.3.0 the project was published as jniltinho/gatus. On v7.0.0, released on 21 September 2026, it got its current name and the image jniltinho/go-uptime.
The license remains the same as the original, Apache 2.0. The file NOTICE records the origin and modification of inherited files. In practice, what matters to those already using Gatus: a Gatus configuration file works without modification. Conditions, endpoints, groups, and alert providers are the same; new features come in as optional blocks.
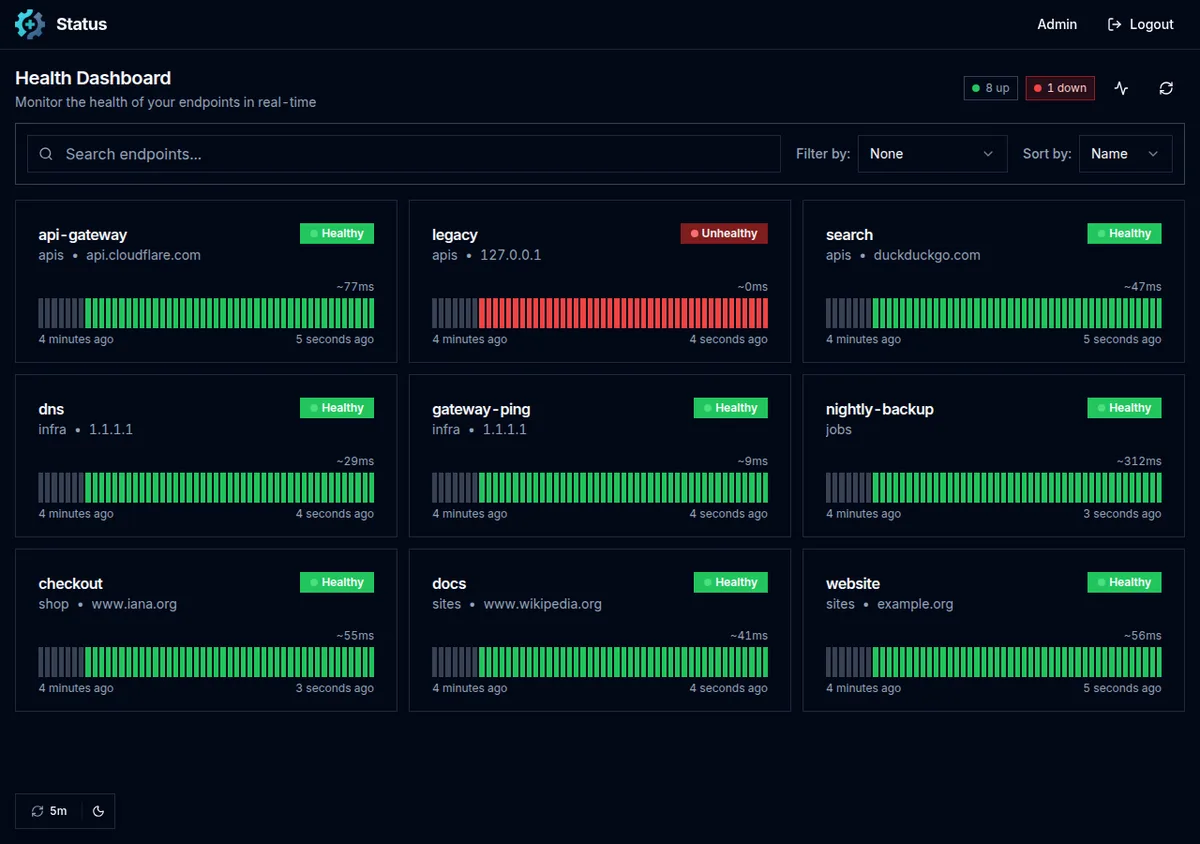
What Go Uptime has beyond Gatus
Everything Gatus does is still there: HTTP, ICMP, TCP, DNS, and other checks, conditions on status, response time, body, and certificate, maintenance windows, suites, and more than 40 alert providers. On top of that, the project adds:
- Web-based administration in
/admin: create, edit, disable, and remove endpoints without restarting the service. In Gatus, endpoints only exist in the configuration file (TwiN/gatus#1345). - Public status pages in
/status/<slug>, opened without login, with the panel protected. In Gatus, this request was closed as not planned (TwiN/gatus#1311). - Push compatible with Uptime Kuma: scripts and cron jobs report their own status to
/api/push/<token>, with the same URLs and responses as Kuma. - MySQL and MariaDB like storage, in addition to SQLite and PostgreSQL. In Gatus, MySQL is not supported.
- Login screen with logout and sessions in the database, instead of the browser authentication window;
curl -ukeeps working. - Backup and restore of what was registered via the web, optionally encrypted.
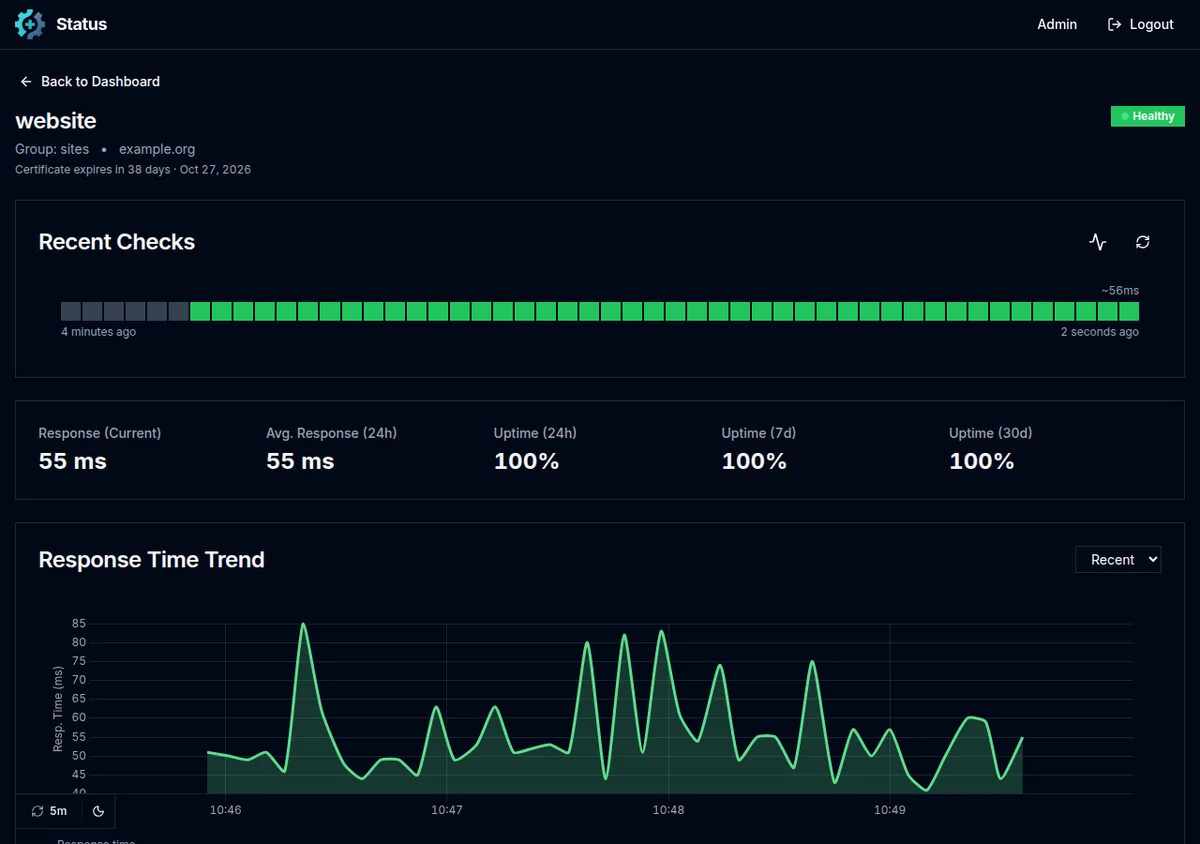
- Response time chart per endpoint, over the periods Recent, 3h, 6h, 24h, and 1w, with average, minimum, and maximum.
- Command line:
config validate,password hash,versionandhealthcheck. - Three themes (dark, light, and bio) and the Inter font served by the binary itself, without calling external services.
If you want an interface for everything and don't mind Node.js, Uptime Kuma is still a good choice. Go Uptime sits in the middle: YAML versioned in Git for what's stable, web for what changes every week.
Spin up with Docker in one minute
The image is on Docker Hub, for amd64 and arm64. There is no tag latest, on purpose: pin the version you run. For a first look, with no persistent history:
mkdir -p go-uptime/config && cd go-uptime
curl -sL -o config/config.yaml \
  https://raw.githubusercontent.com/jniltinho/go-uptime/main/config.yaml
docker run -d --name go-uptime -p 127.0.0.1:8080:8080 \
  -v "$PWD/config:/config" jniltinho/go-uptime:v7.0.0
Open http://127.0.0.1:8080. The example file already comes with endpoints and pages /status/services and /status/infrastructure. In a few seconds, docker ps shows the container as healthy: the image has no shell, and the HEALTHCHECK uses its own subcommand go-uptime healthcheck.
Production with Docker Compose, SQLite and login
To keep history and enable administration, three blocks are required: an SQL store, a login, and admin.enabled. Start by generating the admin password hash:
printf 'troque-esta-senha' | docker run --rm -i jniltinho/go-uptime:v7.0.0 password hashThe command prints the expected base64 bcrypt hash in password-bcrypt-base64. Run in a terminal without the printf, and it prompts for the password twice without echoing it. Then create config/config.yaml:
storage:
  type: sqlite
  path: /data/data.db

security:
  basic:
    username: admin
    password-bcrypt-base64: "COLE-AQUI-O-HASH"

admin:
  enabled: true

endpoints:
  - name: linuxpro
    group: sites
    url: "https://www.linuxpro.com.br"
    interval: 1m
    conditions:
      - "[STATUS] == 200"
      - "[RESPONSE_TIME] < 1000"
      - "[CERTIFICATE_EXPIRATION] > 168h"

  - name: dns-google
    group: infra
    url: "8.8.8.8"
    interval: 1m
    dns:
      query-name: "linuxpro.com.br"
      query-type: "A"
    conditions:
      - "[DNS_RCODE] == NOERROR"
And compose.yaml, with the port published only on 127.0.0.1 so it sits behind a reverse proxy:
services:
  go-uptime:
    image: jniltinho/go-uptime:v7.0.0
    restart: unless-stopped
    ports:
      - "127.0.0.1:8080:8080"
    volumes:
      - ./config:/config:ro
      - go-uptime-data:/data

volumes:
  go-uptime-data:
Before bringing it up, validate the configuration. The config validate loads the file exactly as the server would, but does not open the database or make any requests, and exits with code 1 if anything is wrong. It is the right command to put in a pipeline before deploy:
docker run --rm -v "$PWD/config:/config:ro" jniltinho/go-uptime:v7.0.0 config validate &&
docker compose up -d
curl -s http://127.0.0.1:8080/health
The expected output is something like:
The configuration is valid: 2 endpoints, 0 external endpoints, 0 suites
{"status":"UP"}
With security.basic active, the panel and API require login. /login opens its own screen, the session is stored in the database (only the SHA-256 hash of the token is saved) and the cookie is HttpOnly and SameSite=Strict. Scripts continue to use curl -u admin:senha. Changes to the file do not require a restart: Go Uptime reloads the configuration by itself in up to 30 seconds.
The examples in the repository come up with administration enabled, user admin and password go-uptime. That password is public: the examples only publish the port on 127.0.0.1, and you must change it before placing a proxy in front.
Web-based administration
With login configured, /admin lists the endpoints from the YAML (read-only, marked as YAML) and those registered via the web (marked as Web, with edit, pause, and remove). The web endpoints are stored in the database table managed_endpoints and take effect without a restart. The form has a visual mode and a YAML mode, with a test button before saving for active endpoints.
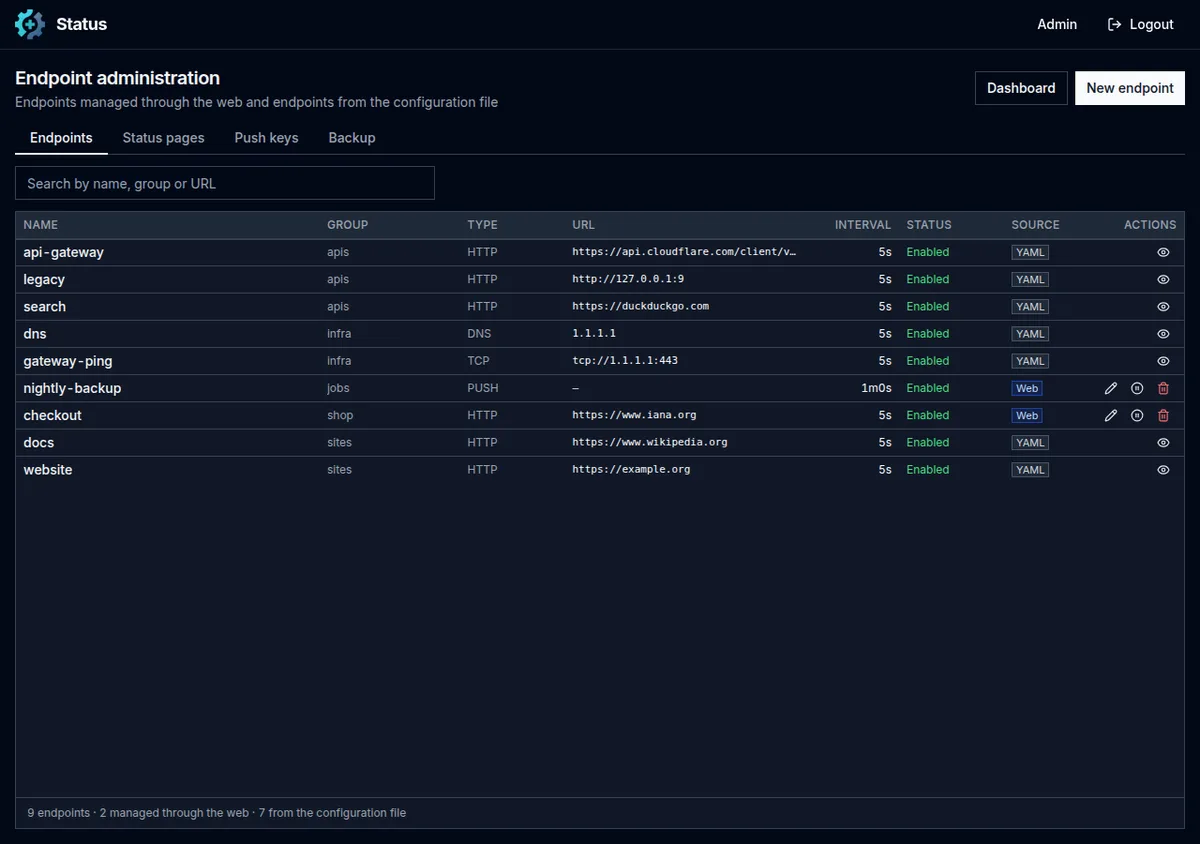
The tabs Status pages, Push keys and Backup are on the same screen. The backup downloads a JSON with endpoints, status pages, and push keys. This file includes tokens, passwords, and headers; therefore there is an option to encrypt with a password (AES-256-GCM). On restore, the screen shows a preview of what will change before applying.
To register many hosts at once, the repository includes the script docs/manager-go-uptime.py, which uses the admin API to import a CSV, rename groups, list endpoints, and export push tokens.
Public status pages
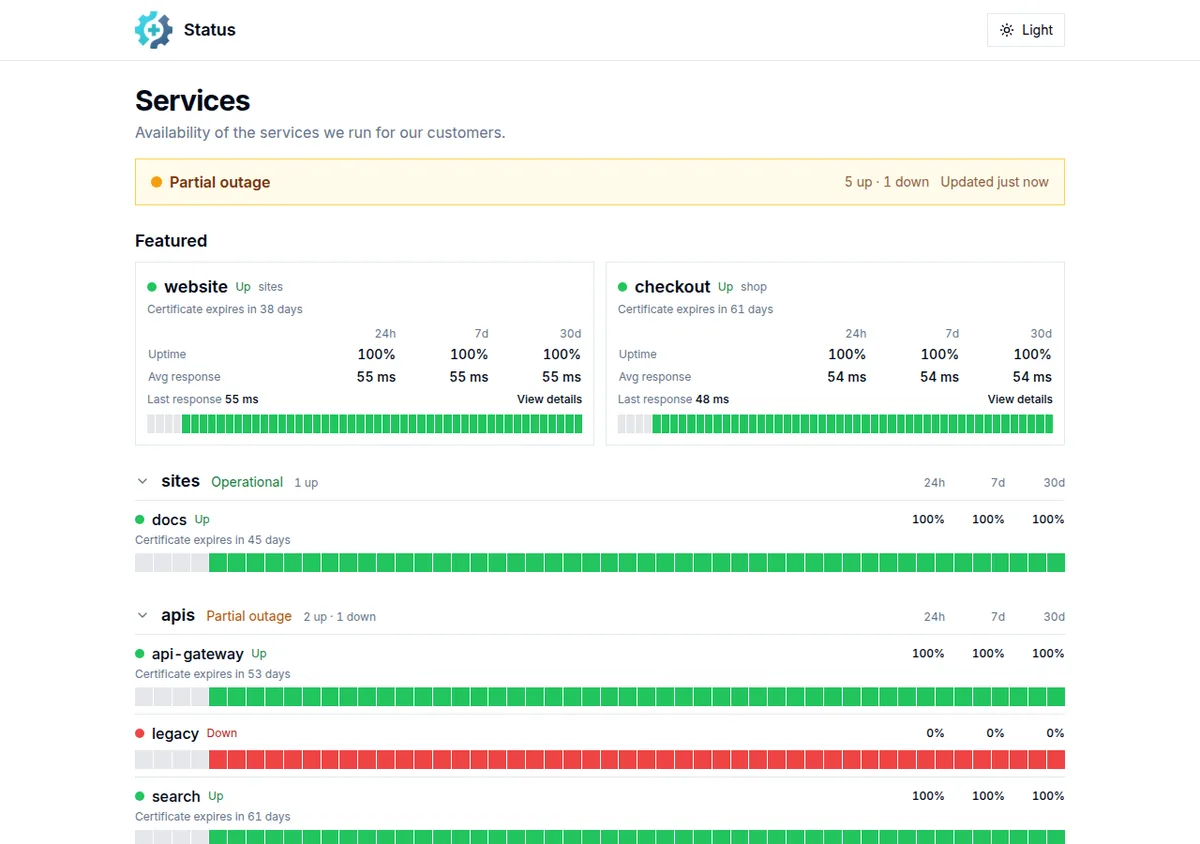
A status page shows only the selected groups and endpoints, without login, while the dashboard, admin, and API stay protected. Each endpoint shows the current state, bars for the latest checks, and uptime for 24 hours, 7 days, and 30 days. Clicking the name opens a details page with the response time chart.
status-pages:
  pages:
    - slug: publica
      title: "Status LinuxPro"
      description: "Disponibilidade dos serviços"
      groups: [sites]
      featured: [sites_linuxpro]
      show-certificate-expiration: true
The key for an endpoint is <grupo>_<nome>, the same one used in badges. featured highlights up to 10 endpoints at the top, and show-certificate-expiration shows how many days are left until the TLS certificate expires. Other useful options: groups-collapsed for pages with hundreds of services and auth to require user and password only on that page. Pages can also be created through the Status pages tab in the administration.
A security detail the documentation makes explicit: the limit maximum-endpoints-per-page (400 by default) is an access rule, not just a display one. An endpoint beyond the cutoff responds 404 in details, graphs, and badges. Raising the limit therefore, publishes more endpoints.
Push: backups and cron jobs that notify when they run
Not everything can be checked from the outside. A cron job, an hourly backup, or a service behind a firewall need to notify that ran. In Go Uptime, this is a Push endpoint: it doesn't check anything, it just records the notices, and marks failure when the interval between heartbeat passes without any push.
external-endpoints:
  - name: backup-noturno
    group: jobs
    token: "troque-por-um-token-longo-e-aleatorio"
    heartbeat:
      interval: 25h
At the end of the backup script, one line is enough:
curl -fsS "https://status.exemplo.com/api/push/troque-por-um-token-longo-e-aleatorio?status=up&msg=backup%20ok&ping=" >/dev/nullThe response is {"ok":true}; unknown token gives back 404 with {"ok":false,"msg":"Monitor not found or not active."}. The parameter status accepts up, pending (yellow result, Go Uptime extension) or any other value as failure; msg appears in the dashboard and in the alert; ping is the time in milliseconds.
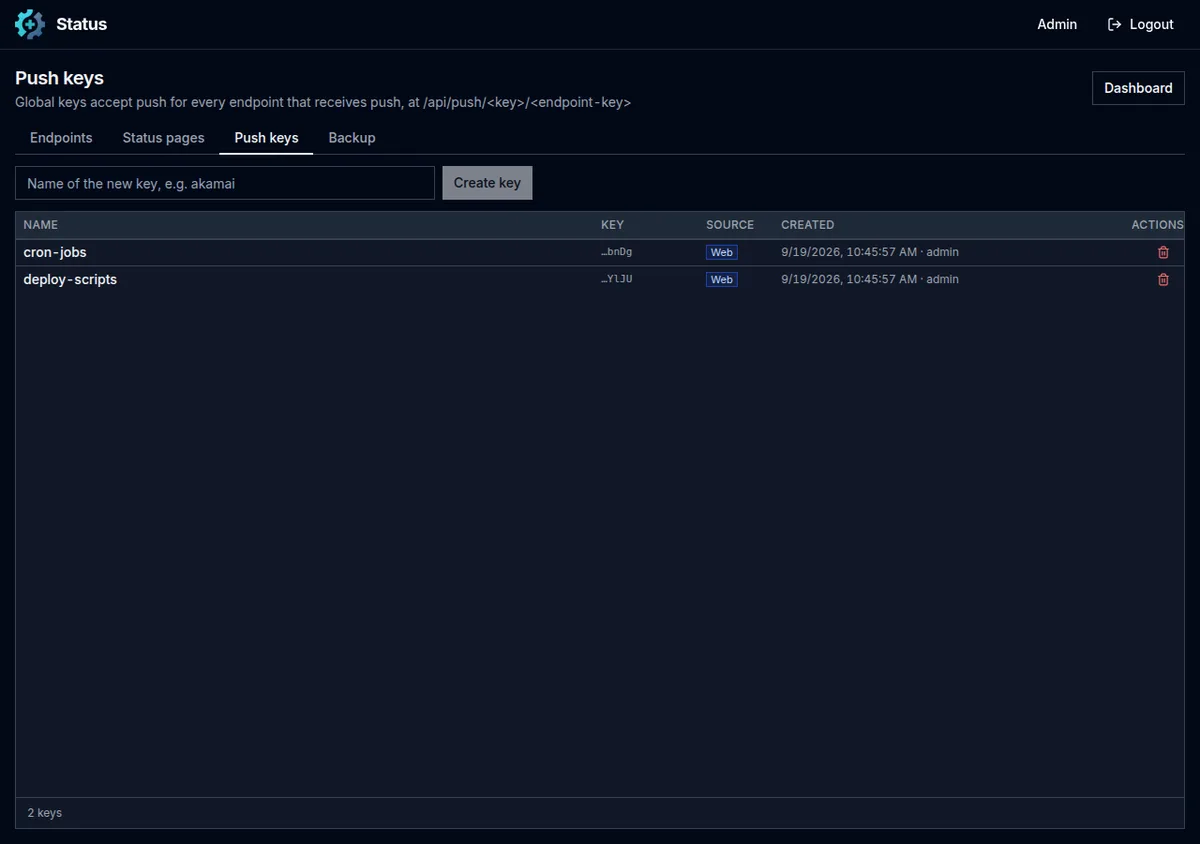
The format is the same as the Uptime Kuma Push monitors: a script that already pushes to Kuma works by only swapping the server address. In addition to the per-endpoint token, the Push keys creates global keys (/api/push/<chave>/<grupo_nome>), stored as a SHA-256 hash and revokable on the spot. Active endpoints (HTTP, TCP, etc.) can also accept push, with push.enabled: true, useful for receiving alerts from an external system.
Alerts
The alert providers are the ones from Gatus: Slack, Telegram, Discord, Teams, Mattermost, PagerDuty, email, custom webhooks, and dozens of others. An example with Telegram, also notifying when the service comes back up:
alerting:
  telegram:
    token: "TOKEN-DO-BOT"
    id: "ID-DO-CHAT"

endpoints:
  - name: linuxpro
    group: sites
    url: "https://www.linuxpro.com.br"
    interval: 1m
    conditions:
      - "[STATUS] == 200"
    alerts:
      - type: telegram
        send-on-resolved: true
The same block alerts applies to Push endpoints: a backup that doesn't report within the heartbeat triggers the alert like any other failure.
MySQL, MariaDB or PostgreSQL
SQLite serves a single instance well. When the database needs to be separate, Go Uptime accepts postgres and mysql, the latter compatible with MySQL 8.4+ and MariaDB 10.11+. The storage.path becomes the DSN:
storage:
  type: mysql
  path: "go_uptime:${MARIADB_PASSWORD}@tcp(mariadb:3306)/go_uptime"
The repository has a complete example in .examples/docker-compose-mariadb-storage, and the documentation on MySQL storage details the user and permissions. The DSN follows the driver format go-sql-driver/mysql; parameters like parseTime and loc are forced by Go Uptime itself, and options like tls=true or timeout=5s can be added.
Without Docker: single binary with systemd
Go Uptime is a static binary, with no runtime or libraries. The Linux installation places everything in /opt/go-uptime, with its own user:
VERSION=7.0.0
ARCH=amd64        # ou arm64

sudo useradd --system --home-dir /opt/go-uptime --shell /usr/sbin/nologin go-uptime
sudo install -d -o root -g go-uptime -m 0750 /opt/go-uptime /opt/go-uptime/config
sudo install -d -o go-uptime -g go-uptime -m 0750 /opt/go-uptime/data

curl -fsSL -o /tmp/go-uptime.tar.gz \
  "https://github.com/jniltinho/go-uptime/releases/download/v${VERSION}/go-uptime_${VERSION}_linux_${ARCH}.tar.gz"
sudo tar xzf /tmp/go-uptime.tar.gz -C /opt/go-uptime go-uptime
sudo chown root:go-uptime /opt/go-uptime/go-uptime && sudo chmod 0750 /opt/go-uptime/go-uptime
sudo -u go-uptime /opt/go-uptime/go-uptime version
The binary and configuration belong to root and are only readable by the group go-uptime: the service cannot overwrite its own executable or the file that stores the password hash. Create /opt/go-uptime/config/config.yaml with web.address: 127.0.0.1, web.port: 8080 and storage.path: /opt/go-uptime/data/data.db, validate with config validate and install the unit published in the repository:
sudo curl -fsSL -o /etc/systemd/system/go-uptime.service \
  https://raw.githubusercontent.com/jniltinho/go-uptime/v7.0.0/docs/systemd/go-uptime.service
sudo systemctl daemon-reload
sudo systemctl enable --now go-uptime
curl -s http://127.0.0.1:8080/health
journalctl -u go-uptime -f
The unit comes hardened: it runs without root, with ProtectSystem=strict and write access enabled only in /opt/go-uptime/data, and validates the configuration at ExecStartPre, The only capability is CAP_NET_RAW, required for ICMP endpoints; if you do not monitor via ping, you can remove it. Logs go to the journal, and the level is set to GO_UPTIME_LOG_LEVEL. To better understand this service model, see our guide on essential systemd commands.
Behind Nginx
The panel uses a real-time event stream to update the screens. This route cannot be buffered by the proxy, and the connection stays open for minutes:
server {
    listen 443 ssl;
    server_name status.exemplo.com;
    # ssl_certificate ...;

    location / {
        proxy_pass http://127.0.0.1:8080;
        proxy_set_header Host $host;
        proxy_set_header X-Forwarded-Proto $scheme;
        proxy_set_header X-Forwarded-For $proxy_add_x_forwarded_for;
    }

    location ~ ^/api/v1/(endpoints|status-pages)/.*/events$ {
        proxy_pass http://127.0.0.1:8080;
        proxy_set_header Host $host;
        proxy_set_header X-Forwarded-Proto $scheme;
        proxy_set_header X-Forwarded-For $proxy_add_x_forwarded_for;
        proxy_buffering off;
        proxy_read_timeout 7m;
    }
}
Host and X-Forwarded-Proto are not just for show: the administration uses these headers to accept changes coming from the address itself and to mark the session cookie as Secure.
Migrating from Gatus
Coming from the original Gatus, the path is to swap the image and reuse the config.yamlas-is, and the new features are optional. Back up the database first and test on a copy.
Coming from the series jniltinho/gatus v6, the migration guide is even shorter: in Docker, only the image name changes. The database does not need migration, the variables GATUS_* continue to be accepted as aliases for the new ones GO_UPTIME_*, and a backup made in v6 restores in v7. What changes, if you rely on it:
- Prometheus metrics change from
gatus_togo_uptime_;metrics-namespace: gatuskeeps the old names; - o
User-Agentof the checks becomesgo-uptime/1.0, which matters if a firewall or WAF allows by this header; - the binary is called
go-uptime, but the image persists/gatusas a symbolic link throughout the 7.x series.
To monitor the server from the inside (CPU, memory, disk), Go Uptime does not replace metrics: combine it with Prometheus and Node Exporter, which can also collect the metrics go_uptime_* that Go Uptime exposes in /metrics when metrics: true is in the configuration.
Is it worth it?
If your team already likes Gatus and only missed a public status page, the ability to register a monitor without opening the server, or to track backups via push, Go Uptime delivers that without switching tools or configuration. The project is new, with frequent releases: pin the tag, run config validate before each deploy and follow the releases before updating. The code, documentation, and examples are in the repository on GitHub.